PHOTO
Share of Dar’s exports to DRC rises to 4.4 percent as that of Kenya and Uganda reels from trade wars. Tanzania is now exporting more of its goods to the Democratic Republic of Congo (DRC) compared to the traditional markets of Kenya and Uganda, highlighting the changing trade dynamics occasioned by new entrants into the EAC bloc and persistent trade wars over tariff and non-tariff barriers (NTBs).
Latest data by the Bank of Tanzania (BoT) reveals that Kinshasa has overtaken Nairobi and Kampala as leading export destinations for Tanzania.
DRC and Somalia joined the EAC in 2022 and 2024 respectively bringing the bloc’s membership to eight. Others are Kenya, Uganda, Tanzania, Rwanda, Burundi and South Sudan.
BoT through its latest annual report (2022/2023 fiscal year) shows that in the last three fiscal years (2020/2021-2022/2023) the share of Tanzania’s exports to DRC increased to 4.4 percent from 3.7 percent while that to Kenya and Uganda declined to 4.1 percent from 4.7 percent and 4.6 percent respectively.
Tanzania’s exports to DRC stood at 3.7 percent and 2.6 percent in 2021/2022 and 2020/2021 respectively.
On the other hand, the share of Tanzania’s exports to Kenya declined to 4.1 percent in 2022/2023 from 6.7 percent in 2021/2022 and 4.7 percent in 2020/2021 while the share of exports to Uganda declined to 4.1 percent in 2022/2023 from 4.2 percent in 2021/2022 and 4.6 percent in 2020/2021.
Tanzania’s exports to Burundi, however, remained relatively unchanged at three percent during the period under review.“South Africa and the Democratic Republic of Congo are the leading export destinations for Tanzania, accounting for 14.8 percent and 4.4 percent of overall exports, respectively,” the report says.“The proportions (trade proportions) have changed since the entry of DRC into the EAC.”Tanzania’s exports of goods to EAC countries mainly comprised cereals, particularly rice and maize, iron and steel, fertilisers and cement, while major imports included iron and steel, soap and detergents, pharmaceutical products, and food and beverages for household consumption, largely sugar and sugar confectionery.
According to the report the bulk of Tanzania’s trade was conducted with China, South Africa and the United Arab Emirates (UAE) where the three countries constituted 43.5 percent and 49.1 percent of Tanzania’s exports and imports respectively during the 2022/2023 fiscal year.
Most of Tanzania’s exports went to India, South Africa and United Arab Emirates whose share of exports stood at 18 percent, 14.8 percent and 10.8 percent respectively in the 2022/2023 fiscal year.
Tanzania also imported more from China, UAE and India with their share of imports standing at 25.5 percent, 12.5 percent and 11.5 percent in the 2022/2023 fiscal year.
The EAC member States are currently working towards reviewing fees, levies and charges imposed by members on essential goods and services in the transport and agriculture sector which have frequently sparked trade wars and choked intra-regional trade in the regional bloc.
Harmonise levies the streamlining of trading costs in Transport and agriculture sector forms the initial phase of a mega plan by the regional authorities to harmonise some levies and fees and completely remove those which they consider ‘inflated’ and ‘discriminatory’ in seven key sectors in the region including transport, agriculture, environment, trade, finance, energy and tourism.
The plan which started in 2021 targets to review additional costs impacting the trading of among other poultry products, day-old chicks, hatching eggs, table eggs, fish and fish products, dairy, veterinary medicine products, pesticides, human and veterinary drugs in Kenya, Uganda, Rwanda, Burundi, Tanzania, South Sudan, Somalia and the Democratic Republic of Congo (DRC).
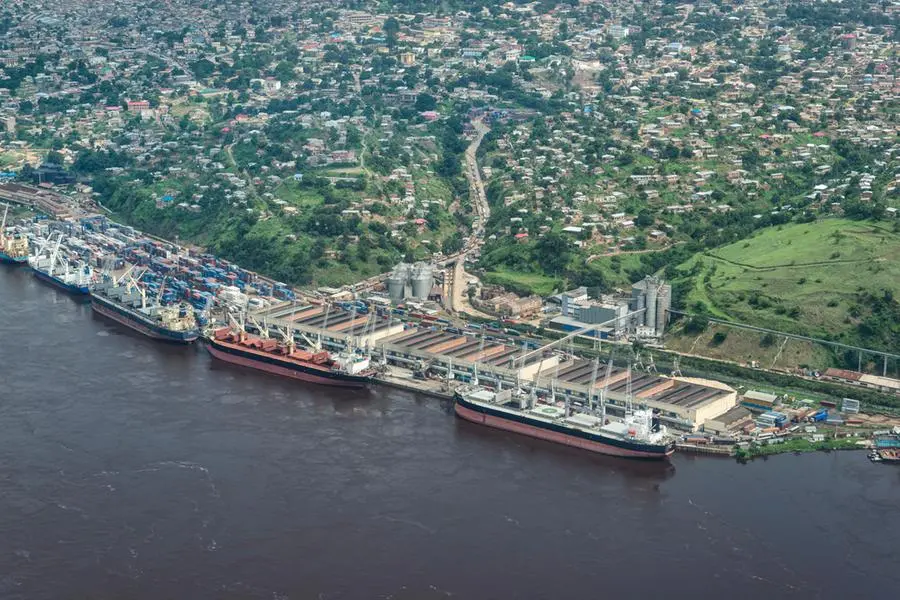
Others are road user charges, passenger service fees in air transport, landing charges, parking levies and navigation charges, as well as ports docking fees for cargo vessels.
Under EAC’s revised four-band common External Tariff (CET) structure, the member states agreed 0 (zero) percent import duty for raw materials and capital goods, 10 percent import duty for intermediate products not available in the EAC region ,25 percent import duty for intermediate products available in the EAC region and 35 percent duty on imported finished products.
Total Intra-EAC trade grew by 11.2 percent to $10.91 billion in 2022 from $9.81 billion whereas the percentage share of Intra-EAC trade to EAC total trade stood at 15 percent in 2022, according to the EA trade and investment report (2022).
The major Intra-EAC traded products are cereals, cement, iron and steel, live animals, petroleum products, sugar, foods and beverages.
During 2022/23, Tanzania exported goods worth $ 1.61 billion to the Southern African Development Community (SADC) member countries, slightly up from $1.26 billion in 2021/2022 fiscal, according to BoT.
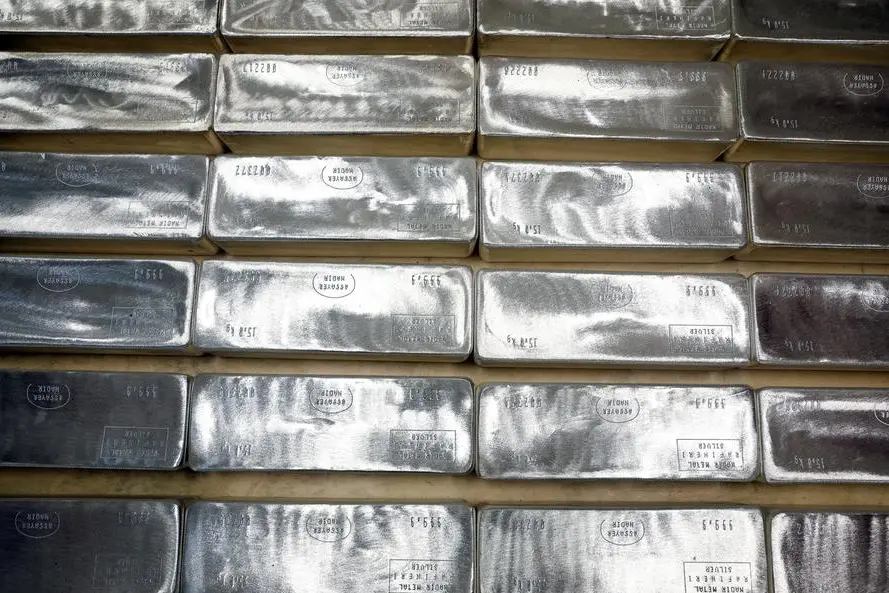
Out of the total exports to SADC, gold accounted for more than 90 percent, of which a larger share was destined to South Africa.
Other exports to SADC included textiles, fertilizers, iron and steel as well as glassware.
The share of Tanzania’s imports from SADC, continues to remain low, accounting for about 4.1 percent of the total imports in 2022/23. South Africa was the major source of imports within SADC, accounting for 3.6 percent.
Exports of Tanzania to the EAC region fell by 9.4 percent to $ 1.3 billion in 2022/23 while imports from the region decreased by 9.4 percent to $ 545.2 million.
Overall, Tanzania recorded a decline in trade surplus with region of $ 755.2 million in 2022/23 from a surplus of $ 879.6 million in 2021/2022.
Tanzania’s exports to EAC countries mainly comprised cereals, particularly rice and maize, iron and steel, fertilizers and cement, while major imports included iron and steel, soap and detergents, pharmaceutical products, and food and beverages for household consumption, largely sugar and sugar confectionery.
Exports of goods increased at a slower pace, rising by 3.8 percent to $7.36 billion in 2022/23 compared with a growth of 10 percent in the preceding year, with the increase mostly driven by non-traditional exports, especially minerals such as gold and coal.
© Copyright 2022 Nation Media Group. All Rights Reserved. Provided by SyndiGate Media Inc. (Syndigate.info).
