PHOTO
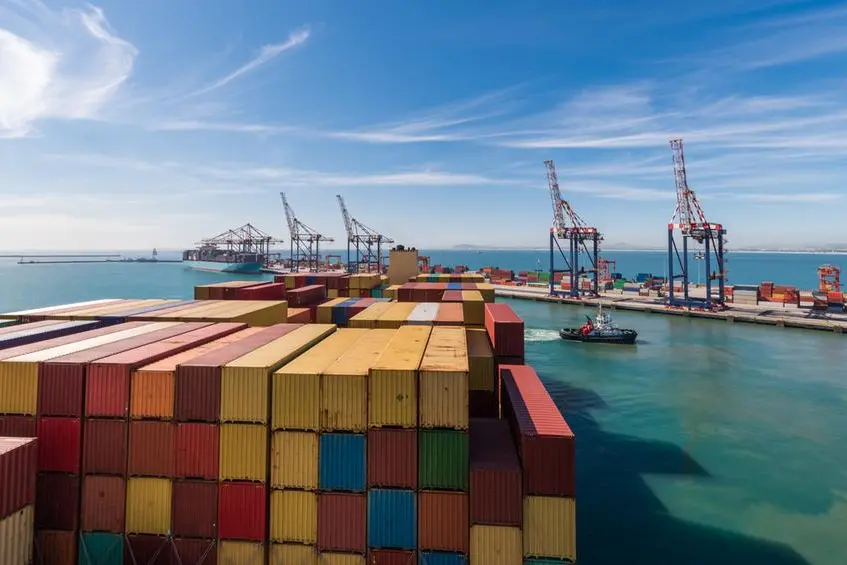
The recently released World Bank (WB) Container Port Performance Index (CPPI) report is damning - harming the reputation of our container terminals. At the outset, it is important to mention that the WB reports on a 2023 period, which does not take into account corrective action taken since then, nor does it measure progress achieved since Transnet has been under new management as part of the recovery and transformation strategy.
To contextualise, this was a period at the height of the crisis; the timing of its release unjustifiably tarnishes today’s developments, casting doubt on the efficacy of robust corrective action underway and the hard work of the recovery teams and the leadership of the National Logistics Crisis Committee (NLCC)—a strong strategic Public | Private consultative initiative by the Government that serves as the anchor.
Improvement strategies
At the same time, we must acknowledge that there are valid points in the report, and we must not simply dismiss it but rather constructively use it as another building block and join hands to ensure that we improve our container port performance, the title and stated objective of the report.
The report's findings are based on an index or ranking of container port performance—not a score—and do not serve as a diagnostic tool to show where a port should improve. Improvement and corrective programmes are the lens industry, and Transnet—particularly Transnet Port Terminals—must continue to apply as a collective focus for our ports, and this is already well underway.
Moreover, the WB report uses rank aggregation, combining multiple rankings into a single ranking. This is a significant problem arising in many areas, and it is an overly simplified approach to providing a single ranking of a complex system that is a port call. Furthermore, as the WB concedes, values are imputed when combinations of port calls and vessel call sizes are missing. The authors caution that the inherent risk with this approach is that poor or good performance within just one group will cascade across all call-size groups.
Therefore, the CPPI is undoubtedly a unidimensional view of port performance. It attempts to examine the system’s performance and devise a single index to indicate whether it is good or bad.
Beyond rankings: A more nuanced view
Despite this methodology critique, SAAFF believes the report emphasised that South Africa lost time wasted at outer anchorages, which we (and Transnet) accept. Nevertheless, using a vessel’s stay duration as the sole measure of container port performance without considering other factors like throughput and handling rates highlights key obstacles to using the findings to measure container port performance accurately on a comparative basis.
Furthermore, the WB concedes that “it is impossible to see from the data whether waiting time is voluntary or forced; it is difficult to find a suitable level at which to discount waiting time in this scenario.” The report also states that S&P Global uses tracking and observation tools to determine where vessels anchor and create zones accordingly. We must, therefore, conclude that South African ports were excessively penalised for time lost at anchorage.
South Africa's performance
However, if we isolate port performance based on time and efficiency (as the WB sets out), we find that in Durban Pier 1, our GCH is around 15.8 moves per hour. At Durban Pier 2, our GCH was around 16.4 moves per hour. This is 33% and 30% below the global average, respectively, but by no means “the worst” in the world.
Some examples show that the terminals reached 32 GCH in isolated cases, nearing global best practices. So, one might argue that a container terminal capable of sometimes achieving global best practices can certainly not be considered the worst in the world. But at the same time, South African port users come from a background where rates of around 25 were relatively common in the not-too-distant past, and this is what makes the current performance so worrying.
Furthermore, there is no mention of the volume or frequency of schedules. To look at some examples, regional ports included in the study, such as the Port of Maputo, only had 87 vessel calls and only serviced vessel sizes up to 5,000 TEUs. Another example is the Port of Nacala or Port Sudan, which only had 27 and 26 vessel calls, respectively and also serviced vessel sizes up to 5,000 TEUs.
According to the WB's dataset, Cape Town and Durban had 196 and 499 vessel calls, respectively, and both handled larger Neo-Panamax vessels (8,501-13,500 TEU). So, to compare these examples to our ports when considering the volume or frequency of schedules is entirely invalid.
According to our analysis, vessel dwell time for Durban during the period was 83.2 hours at Pier 2 and 67.4 hours at Pier 1, respectively. This was against the global average of 40.5 hours. This shows that time spent at South African ports is too much, but arguably not the worst in the world.
The path forward: Specialisation and investment
What is critical now—a reality that the report emphasises in somewhat crude terms—is that our port system needs to bring in specialisation and investment through Private Sector Participation, allowing for competition between the ports and terminals within the ports (intra-port competition).
In our current landscape, whatever transpires politically is true for our logistics network. It is incumbent upon us to create a new dawn where the focus is on utilising trade, transport, and logistics as a critical driver for economic growth and development—especially for an open economy such as South Africa—at the dawn of a new multi-dimensional democracy.
All rights reserved. © 2022. Bizcommunity.com Provided by SyndiGate Media Inc. (Syndigate.info).
