PHOTO
Geneva -- The International Air Transport Association (IATA) released data for November 2023 air travel performance indicating that air travel demand topped 99% of 2019 levels.
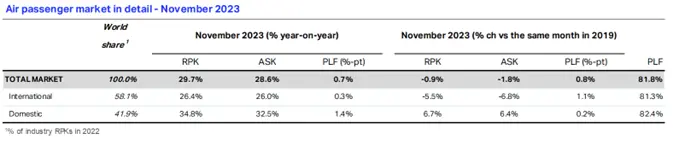
- Total traffic in November 2023 (measured in revenue passenger kilometers or RPKs) rose 29.7% compared to November 2022. Globally, traffic is now at 99.1% of November 2019 levels.
- International traffic rose 26.4% versus November 2022. The Asia-Pacific region continued to report the strongest year-over-year results (+63.8%) with all regions showing improvement compared to the prior year. November 2023 international RPKs reached 94.5% of November 2019 levels.
- Domestic traffic for November 2023 was up 34.8% compared to November 2022. Total November 2023 domestic traffic was 6.7% above the November 2019 level. Growth was particularly strong in China (+272%) as it recovered from the COVID travel restrictions that were still in place a year ago. US domestic travel, benefitting from strong Thanksgiving holidays demand, reached a new high, expanding +9.1% over November 2019.
“We are moving ever closer to surpassing the 2019 peak year for air travel. Economic headwinds are not deterring people from taking to the skies. International travel remains 5.5% below pre-pandemic levels but that gap is rapidly closing. And domestic markets have been above their pre-pandemic levels continuously since April,” said Willie Walsh, IATA’s Director General.
| Air passenger market in detail - November 2023 |
|
|
| |||
|
| World |
| November 2023 (% year-on-year) |
| ||
|
| share1 |
| RPK | ASK | PLF (%-pt) | PLF (level) |
| TOTAL MARKET | 100.0% |
| 29.7% | 28.6% | 0.7% | 81.8% |
| Africa | 2.1% |
| 20.3% | 27.1% | -4.0% | 70.4% |
| Asia Pacific | 22.1% |
| 80.1% | 71.7% | 3.8% | 81.4% |
| Europe | 30.8% |
| 13.6% | 13.5% | 0.1% | 83.7% |
| Latin America | 6.4% |
| 12.0% | 9.1% | 2.2% | 84.4% |
| Middle East | 9.8% |
| 18.7% | 18.4% | 0.2% | 77.7% |
| North America | 28.8% |
| 10.2% | 11.3% | -0.8% | 82.7% |
| 1% of industry RPKs in 2022 |
|
|
|
|
|
|
International Passenger Markets
Asia-Pacific airlines had a 63.8% rise in November traffic compared to November 2022, which was the strongest year-over-year rate among the regions. Capacity rose 58.0% and the load factor was up 2.9 percentage points to 82.6%.
European carriers’ November traffic climbed 14.8% versus November 2022. Capacity increased 15.2%, and load factor declined 0.3 percentage points to 83.3%.
Middle Eastern airlines saw an 18.6% traffic rise in November compared to November 2022. November capacity increased 19.0% versus the year-ago period, and load factor fell 0.2 percentage points to 77.4%.
North American carriers experienced a 14.3% traffic rise in November versus the 2022 period. Capacity increased 16.3%, and load factor fell 1.4 percentage points to 80.0%.
Latin American airlines’ November traffic rose 20.0% compared to the same month in 2022. November capacity climbed 17.7% and load factor increased 1.7 percentage points to 84.9%, the highest of any region.
African airlines had a 22.1% rise in November RPKs versus a year ago. November 2023 capacity was up 29.6% and load factor fell 4.3 percentage points to 69.7%, the lowest among regions.
Domestic Passenger Markets
| Air passenger market in detail - November 2023 |
|
|
| ||||
|
| World |
| November 2023 (% year-on-year) |
| |||
|
| share1 |
| RPK | ASK | PLF (%-pt) | PLF (level) | |
| Domestic | 41.9% |
| 34.8% | 32.5% | 1.4% | 82.4% | |
| Dom. Australia | 1.0% |
| 13.2% | 7.6% | 4.3% | 85.3% | |
| Domestic Brazil | 1.5% |
| 2.3% | -0.1% | 1.9% | 82.7% | |
| Dom. China P.R. | 6.4% |
| 272.0% | 212.4% | 12.4% | 77.4% | |
| Domestic India | 2.0% |
| 10.9% | 12.9% | -1.5% | 86.2% | |
| Domestic Japan | 1.2% |
| 5.9% | 0.4% | 4.2% | 80.0% | |
| Domestic US | 19.2% |
| 8.9% | 9.8% | -0.7% | 83.7% | |
| 1% of industry RPKs in 2022 |
|
|
|
|
|
| |
| Note: the six domestic passenger markets for which broken-down data are available account for approximately 31.3% of global total RPKs and 74.6% of total domestic RPKs | |||||||
The Bottom Line
“Aviation’s rapid recovery from COVID demonstrates just how important flying is to people and to businesses. In parallel to aviation’s recovery, governments recognized the urgency of transitioning from jet fuel to Sustainable Aviation Fuel (SAF) for aviation’s decarbonization. The Third Conference on Aviation Alternative Fuels (CAAF/3) in November saw governments agree that we should see 5% carbon savings by 2030 from SAF. This was followed up at COP28 in December where governments agreed that we need a broad transition from fossil fuels to avoid the worst effects of climate change. Airlines don’t need convincing. They agreed to achieve net zero carbon emissions by 2050 and every drop of SAF ever made in that effort has been bought and used. There simply is not enough SAF being produced. So we look to 2024 to be the year when governments follow-up on their own declarations and finally deliver comprehensive policy measures to incentivize the rapid scaling-up of SAF production,” said Walsh.
Read the latest Air Passenger Market Analysis
About IATA
- IATA (International Air Transport Association) represents some 300 airlines comprising 83% of global air traffic.
- You can follow us at twitter.com/iata for announcements, policy positions, and other useful industry information.
- Fly Net Zero
- Statistics compiled by IATA Economics using direct airline reporting complemented by estimates, including the use of FlightRadar24 data provided under license.
- All figures are provisional and represent total reporting at time of publication plus estimates for missing data. Historic figures are subject to revision.
- Domestic RPKs accounted for about 41.9% of the total market in 2022. The six domestic markets in this report account for 31.3% of global RPKs.
- Explanation of measurement terms:
- RPK: Revenue Passenger Kilometers measures actual passenger traffic
- ASK: Available Seat Kilometers measures available passenger capacity
- PLF: Passenger Load Factor is % of ASKs used.
- IATA statistics cover international and domestic scheduled air traffic for IATA member and non-member airlines.
- Total passenger traffic market shares by region of carriers for 2022 in terms of RPK are: Asia-Pacific 22.1%, Europe 30.8%, North America 28.8%, Middle East 9.8%, Latin America 6.4%, and Africa 2.1%.