(Geneva) - The International Air Transport Association (IATA) announced that both international and domestic travel demand showed significant momentum in July 2021 compared to June, but demand remained far below pre-pandemic levels. Extensive government-imposed travel restrictions continue to delay recovery in international markets.
Because comparisons between 2021 and 2020 monthly results are distorted by the extraordinary impact of COVID-19, unless otherwise noted all comparisons are to July 2019, which followed a normal demand pattern.
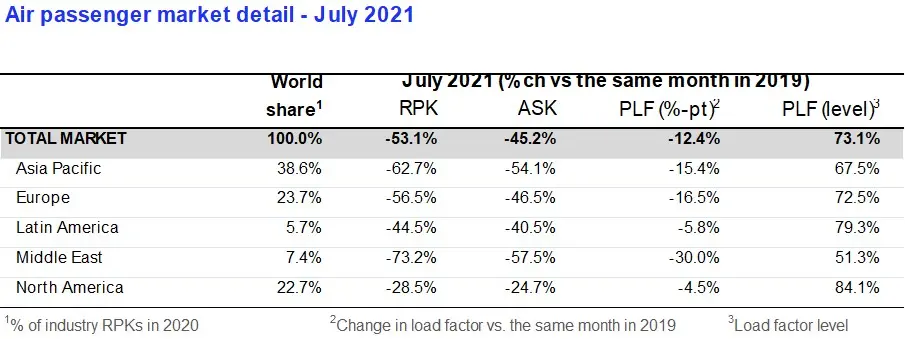
- Total demand for air travel in July 2021 (measured in revenue passenger kilometers or RPKs) was down 53.1% compared to July 2019. This is a significant improvement from June when demand was 60% below June 2019 levels.
- International passenger demand in July was 73.6% below July 2019, bettering the 80.9% decline recorded in June 2021 versus two years ago. All regions showed improvement and North American airlines posted the smallest decline in international RPKs (July traffic data from Africa was not available).
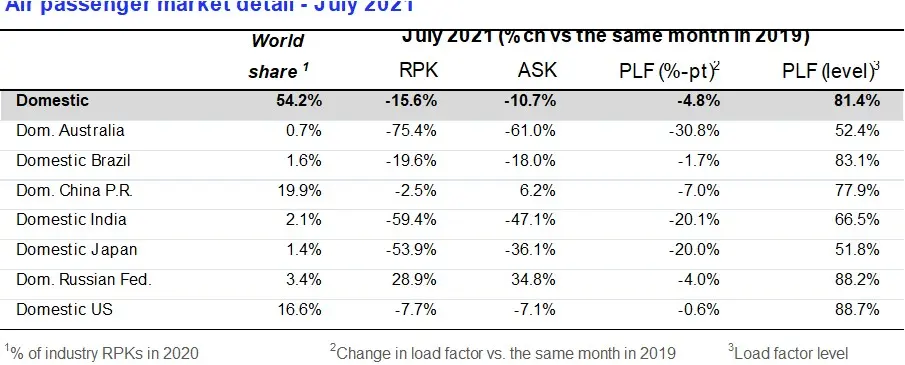
- Total domestic demand was down 15.6% versus pre-crisis levels (July 2019), compared to the 22.1% decline recorded in June over June 2019. Russia posted the best result for another month, with RPKs up 28.9% vs. July 2019.
“July results reflect people’s eagerness to travel during the Northern Hemisphere summer. Domestic traffic was back to 85% of pre-crisis levels, but international demand has only recovered just over a quarter of 2019 volumes. The problem is border control measures. Government decisions are not being driven by data, particularly with respect to the efficacy of vaccines. People traveled where they could, and that was primarily in domestic markets. A recovery of international travel needs governments to restore the freedom to travel. At a minimum, vaccinated travelers should not face restrictions. That would go a long way to reconnecting the world and reviving the travel and tourism sectors,” said Willie Walsh, IATA’s Director General.


International Passenger Markets
European carriers saw their July international traffic decline 64.2% versus July 2019, significantly bettering the 77.0% decrease in June compared to the same month in 2019. Capacity dropped 53.8% and load factor fell 19.9 percentage points to 69.0%.
Asia-Pacific airlines’ July international traffic fell 94.2% compared to July 2019, barely improved over the 94.7% drop registered in June 2021 versus June 2019 as the region continues to have the strictest border control measures. Capacity dropped 86.0% and the load factor was down 48.2 percentage points to 34.3%, by far the lowest among regions.
Middle Eastern airlines posted a 74.5% demand drop in July compared to July 2019, surpassing the 79.2% decrease in June, versus the same month in 2019. Capacity declined 59.5%, and load factor deteriorated 30.1 percentage points to 51.3%.
North American carriers’ July demand fell 62.1% compared to the 2019 period, much improved on the 69.4% decline in June versus two years ago. Capacity sank 52.0%, and load factor dipped 18.6 percentage points to 69.3%.
Latin American airlines saw a 66.3% drop in July traffic, compared to the same month in 2019, improved over the 69.8% decline in June compared to June 2019. July capacity fell 60.5% and load factor dropped 12.6 percentage points to 72.9%, which was the highest load factor among the regions for the ninth consecutive month.
Domestic Passenger Markets


Australia’s domestic traffic sank further from a 51.4% decline in June versus the same month in 2019, to a 75.4% decline in July versus two years ago, amid stricter domestic lockdowns in response to a spike in the Delta variant.
US domestic traffic continued to recover in July, and was down just 7.7% compared to July 2019, improved from a 14.0% decline in June versus June 2019.
The Bottom Line
“As the Northern Hemisphere summer travel season draws to a close it is clear that too many governments missed the opportunity to apply a risk-based approach to managing their borders. The growing number of fully vaccinated travelers and the prevalence of testing provided the chance to restore international connectivity and bring much needed relief to economies that are heavily reliant on travel and tourism. Instead, governments continued to behave as if it was the summer of 2020. Economies and the labor force will pay the price for decisions that were made not based on science, but on political expediency. Governments have rightly urged their populations to be vaccinated; now governments need to have confidence in the benefits of vaccinations—including the freedom to travel,” said Walsh.
View the full July Air Passenger Market Analysis (including 2021 vs. 2020 comparisons)
-Ends-
For more information, please contact:
Corporate Communications
Tel: +41 22 770 2967
Email: corpcomms@iata.org
- IATA (International Air Transport Association) represents some 290 airlines comprising 82% of global air traffic.
- You can follow us at https://twitter.com/iata for announcements, policy positions, and other useful industry information.
- Statistics compiled by IATA Economics using direct airline reporting complemented by estimates, including the use of FlightRadar24 data provided under license.
- All figures are provisional and represent total reporting at time of publication plus estimates for missing data. Historic figures are subject to revision.
- Domestic RPKs accounted for about 54.3% of the total market.
- Explanation of measurement terms:
- RPK: Revenue Passenger Kilometers measures actual passenger traffic
- ASK: Available Seat Kilometers measures available passenger capacity
- PLF: Passenger Load Factor is % of ASKs used.
- IATA statistics cover international and domestic scheduled air traffic for IATA member and non-member airlines.
- In 2020, total passenger traffic market shares by region of carriers in terms of RPK were: Asia-Pacific 38.6%, Europe 23.7%, North America 22.7%, Middle East 7.4%, Latin America 5.7%, and Africa 1.9%.
© Press Release 2021
Disclaimer: The contents of this press release was provided from an external third party provider. This website is not responsible for, and does not control, such external content. This content is provided on an “as is” and “as available” basis and has not been edited in any way. Neither this website nor our affiliates guarantee the accuracy of or endorse the views or opinions expressed in this press release.
The press release is provided for informational purposes only. The content does not provide tax, legal or investment advice or opinion regarding the suitability, value or profitability of any particular security, portfolio or investment strategy. Neither this website nor our affiliates shall be liable for any errors or inaccuracies in the content, or for any actions taken by you in reliance thereon. You expressly agree that your use of the information within this article is at your sole risk.
To the fullest extent permitted by applicable law, this website, its parent company, its subsidiaries, its affiliates and the respective shareholders, directors, officers, employees, agents, advertisers, content providers and licensors will not be liable (jointly or severally) to you for any direct, indirect, consequential, special, incidental, punitive or exemplary damages, including without limitation, lost profits, lost savings and lost revenues, whether in negligence, tort, contract or any other theory of liability, even if the parties have been advised of the possibility or could have foreseen any such damages.


