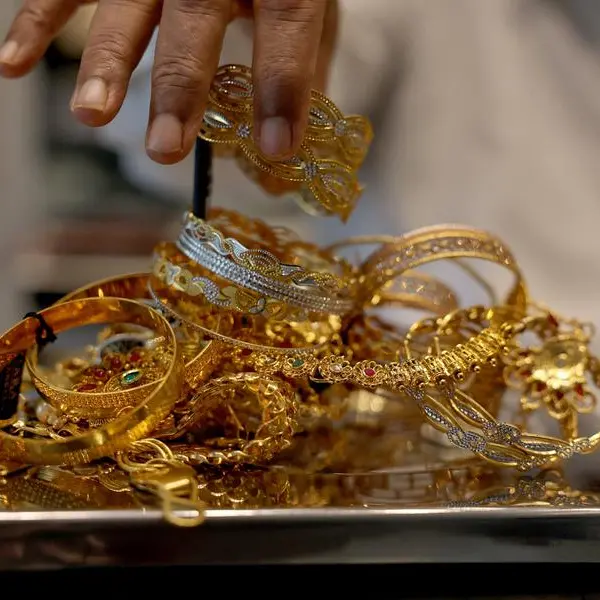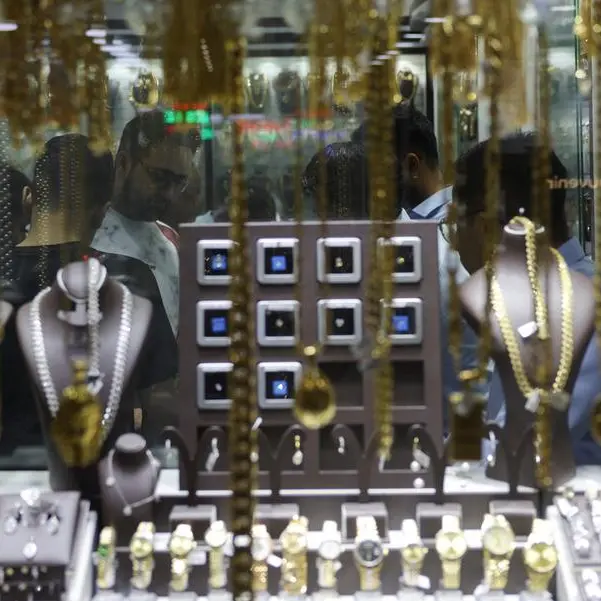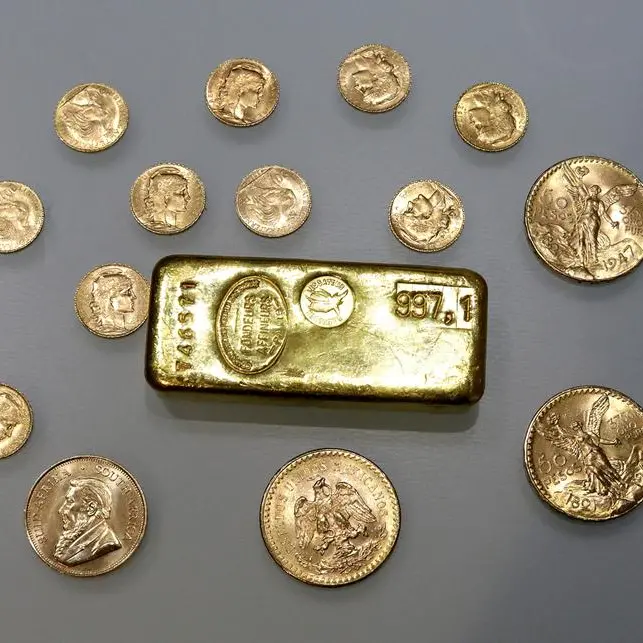
PHOTO
LONDON - Global gold demand excluding over-the-counter (OTC) trading fell 6% year-on-year to 929 metric tons in the second quarter as jewellery consumption tumbled 19% amid high prices, the World Gold Council (WGC) said on Tuesday.
Spot gold prices are up 15% so far this year after hitting a record high of $2,483.60 on July 17 amid increased market expectations that the U.S. Federal Reserve will cut interest rates in September.
The second quarter "saw price sensitivity bite into jewellery demand and it may be a while before consumers fully adjust to higher prices", said the WGC, an industry body whose members are global gold miners.
Gold jewellery consumption in April-June saw its weakest second quarter since 2020, when demand was feeling the worst impact of the COVID-19 pandemic, the WGC said.
However, total demand including the opaque OTC trading rose 4% to 1,258 tons, marking the strongest second quarter in the WGC's data series going back to 2000.
The WGC estimates the OTC flows - investment from institutional, high-net-worth investors and family offices - at 329 tons, the strongest since final quarter of 2020. "Demand from this sector has been in response to concern over the U.S. debt burden, geopolitical risks and attraction to the strong price rise," it said.
Global central banks, which actively bought gold in 2022-2023, increased purchases for their reserves by 6% to 183 tons in the second quarter.
They are on track to slow buying in full-2024 by 150 tons from 2023 but to keep them above the pre-2022 level. Physically-backed gold exchange traded funds (ETFs) saw modest outflows in the second quarter and were heading for the third consecutive month of net inflows in July.
Bar and coin investment fell 5%, while demand for gold in technology rose 11% "driven by the AI boom in the electronics sector", the WGC said.
On the supply side, mine production increased by 3% to the second-quarter record, while recycling rose by 4% to the highest for a second quarter since 2012.
Gold supply and demand by WGC*: Q2 2023 Q1 2024 Q2 2024 Q2 change y/y (%) Supply Mine production 899.7 859.1 929.1 3 Net producer hedging -15.7 -24.5 -6.3 - Recycled gold 324.0 348.5 335.4 4 Total supply 1,207.9 1,183.1 1,258.2 4 Demand Jewellery fabrication: 494.1 534.4 410.6 -17 - Jewellery consumption 479.4 479.1 390.6 -19 - Jewellery inventory 14.7 55.2 20.0 36 Technology: 72.8 80.5 81.1 11 - Electronics 59.1 66.4 67.6 14 - Other industrial 11.3 11.8 11.3 0 - Dentistry 2.4 2.3 2.3 -5 Investment: 252.6 200.4 253.9 1 - Total bar and coin: 273.7 313.4 261.0 -5 of which bars 164.0 223.3 183.6 12 of which official coins 85.3 66.0 52.7 -38 of which medals 24.4 24.1 24.8 2 - ETFs/similar products -21.1 -113.0 -7.2 - Central banks, other inst. 173.6 299.9 183.4 6 Gold demand 993.1 1,115.2 929.0 -6 OTC and other 214.9 67.9 329.2 53 Total demand 1,207.9 1,183.1 1,258.2 4 LBMA gold price ($/oz) 1,975.9 2,069.8 2,338.2 18
* Source: Metals Focus, Refinitiv GFMS, ICE Benchmark Administration, World Gold Council.
(Reporting by Polina Devitt; editing by Gareth Jones)