PHOTO
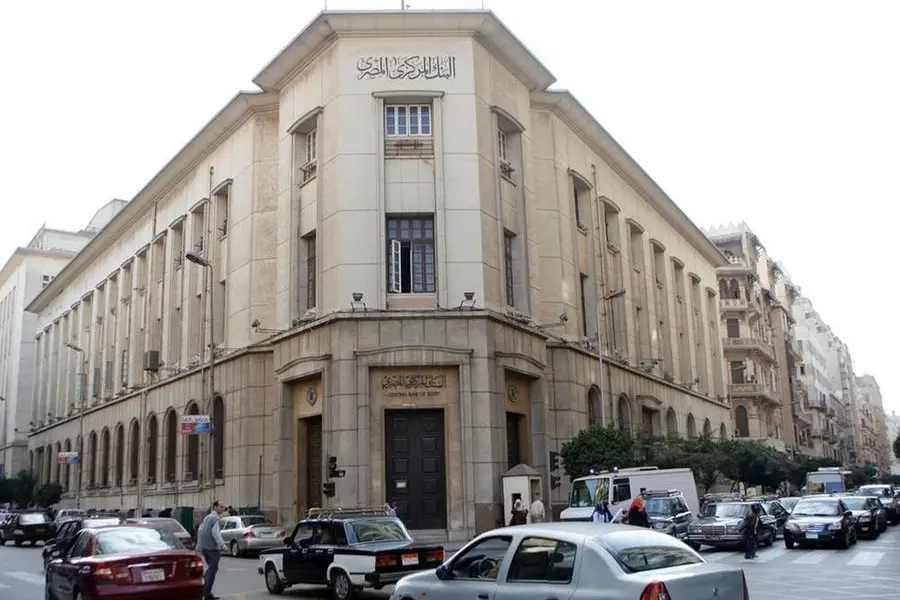
The Central Bank of Egypt (CBE) revealed the developments of Egypt’s external debt by December 2022. The CBE said, in a recent report, that the external debt registered $162.9bn in December 2022, up by about $7.2bn, compared to June 2022.
This came as a result of the rise in net disbursements of loans and facilities by $7.2bn and the appreciation of the US dollar exchange rate vis-à-vis the other currencies of the external debt which led to a decrease of $34.6m.
Breakdown by maturity
By original maturity, external debt reaffirmed its pattern of long-term debt predominance in December 2022. Long-term debt accounted for $132.7bn or 81.4% of the total external debt, whereas short-term debt accounted for $30.2bn or 18.6%.
By residual maturity, short-term debt amounted to about $47bn in December 2022. Meanwhile, long-term debt reached about $115.9bn.
Breakdown by type
Long-term external debt registered $132.7bn (81.4% of total external debt) in December 2022, up by about $3.6bn compared to June 2022. This is illustrated in the following:
ï Buyers’ and suppliers’ credit reached about $18.5bn, up by $2.1bn, as compared to June 2022.
ï Multilateral institutions’ debt reached about $52.2bn, up by $0.9bn as compared to June 2022.
ï Other bilateral debt 1 amounted to some $11.8bn, up by $654.4m.
ï Repurchase Agreements (Repo) registered about $4.3bn in December 2022, up by $55.9m.
ï Bonds issued abroad (non-resident holdings) reached $29bn, up by $40.2m. Bonds outstanding stock as of December 2022 include: Roughly $23.5bn of Eurobonds issued in US dollar, the equivalent of about $4bn of Eurobonds denominated in euro, about $737.2m of green bonds issued in US dollar, The equivalent of about $448.4m of Samurai bonds issued in Japanese yen, and about $355.4m of sovereign notes issued in US dollar.
The following table shows the nominal values of these bonds as well as their issue and maturity dates as in December 2022:
Long-term deposits placed at the CBE by some Arab countries registered about $15bn. These deposits are distributed as follows: $5.7bn by the United Arab Emirates, $5.3bn by Saudi Arabia, $4bn by Kuwait.
ï Non-guaranteed debt of the private sector reached $798.9m, down by $35.1m. It includes the Green Bonds issued by the Commercial International Bank last July 2021 with a nominal value of $100m.
ï Rescheduled bilateral debt reached around $1.1bn, down by $121.6m.
Short-term debt increased by about $3.6bn to about $30.2bn, or 18.6% of total external debt. Newly placed Arab countries’ deposits at the CBE constitute almost half of the short-term debt stock in December 2022, registering $14.9bn ($5bn from each of the UAE and Saudi Arabia, $4bn from Qatar, and $900m from Libya). This is in addition to about $2.6bn representing the Chinese Currency Swap Agreement between the CBE and the People’s Bank of China.
Breakdown by currency
Measuring the currency composition of Egypt’s external debt is an important indicator that sheds light on the external debt exposure to currency markets’ volatility. The currency composition of external debt reveals that the US dollar is the main borrowing currency ($110.7bn; or 67.9%) in December 2022. Other major currencies recorded $52.2bn, distributed as follows: SDRs 1 were the runner-up ($22.9bn), followed by the euro ($16.8bn), the Kuwaiti dinar ($4bn), the Chinese yuan ($3.4bn), the Japanese yen ($2.8bn), and other currencies ($2.3bn).
Breakdown by creditor
Debt distribution by the creditor indicates that $52.2bn was owed to multilateral institutions. The IMF loans alone represent 41.7% of these institutions’ loans or about $21.7bn, classified as follows: $9.9bn representing Extended Fund Facility (EFF), $2.7bn representing Rapid Financing Instrument (RFI), $5bn representing Standby Arrangement (SBA), $3.8bn representing SDR allocation, $347.5m representing the first tranche of the New Extended Fund Facility.
The other major multilateral creditors came next, namely the International Bank for Reconstruction and Development ($12.1bn or 23.3%), the European Investment Bank ($4.4bn or 8.5%), the African Export–Import Bank ($4.3bn or 8.3%), and the African Development Bank ($2.6bn or 5%).
Additionally, $42.5bn were owed to Arab countries mainly; UAE4 (11.4% of total external debt), Saudi Arabia (7.7%), Kuwait (3.8%), and Qatar (2.5%).
Meanwhile, $11.5bn came from five members of Paris Club countries, namely; the UK ($3bn), Germany ($2.7bn), Japan ($2.6bn), France ($2.4bn), and the USA ($0.8bn). In addition, $8bn was owed to China.
Breakdown by debtor sector
The structure of Egypt’s external debt by debtor sector in December 2022 compared to June 2022 reveals that:
Other sectors’ debt increased by about $3.8bn to $18.6bn, representing 11.4% of external debt
Banks’ external debt increased by about $1.6bn to $19.3bn, representing 12% of external debt.
The Central Bank’s external debt increased by about $1.4bn to $42.3bn, representing 25.9% of external debt.
Government remains the main obligor, with a share of around 50.7% of external debt. Its debt increased by about $420.8m, reaching $82.7bn.
External debt service
Debt service reached $11.9bn (principal repayments registered $9.1bn, and interest payments $2.8bn) in July/December 2022/2023, compared to $13.7bn in July/December 2021/2022. The decrease reflects the reduction in principal repayments by about $2.6bn, whereas interest payments decreased by about $0.8bn.
External debt indicators
External debt stock to GDP represented 35.5% in December 2022 compared to 32.6% in June 2022, well below the IMF’s external debt sustainability threshold (50%).
Short-term external debt by original maturity to total external debt registered 18.6% in December 2022 (against 17.1% in June 2022).
Its ratio to net international reserves increased to 89% in December 2022 from 79.7% in June 2022.
Debt-service ratio increased to 32.1% in December 2022 compared to 37.1% in June 2022. However, debt service ratio when calculated as a ratio to current receipts2 improves considerably to reach 23.1% in December 2022 compared to 25.2% in June 2022.
External Liquidity
Net international reserves
During July/December 2022/2023, the net international reserves (NIR) increased by $0.6bn (against an increase of $0.4bn in the corresponding period a year earlier) to reach $34bn, thus covering 5.5 months of merchandise imports in December 2022.
The increase was mainly ascribed to the pickup in foreign currencies by the same amount.
During the preparation of the Report, NIR reached $34.6bn in April 2023, covering 5.6 months of merchandise imports.
Net foreign assets of banks
Banks’ net foreign assets witnessed an inconsiderable decrease by $0.02bn during July/December 2022/2023 (against a decrease of $11.7bn in the corresponding period a year earlier).
Foreign currency deposits with banks increased by 4.1% to $47bn in December 2022.
Likewise, the local currency deposits increased by 8.5%. As such, the ratio of foreign currency deposits to total deposits made up 17.7% in December 2022.
International investment position
Egypt’s net international investment position (IIP) recorded net external liabilities (assets minus liabilities) of $247.9bn in December 2022, up by 5.9%, compared with $234.1bn in June 2022. This increase in negative net IIP was mainly attributed to the decrease in the assets and the rise in the liabilities as compared to June 2022.
Assets and liabilities by component
Claims on non-residents (assets) decreased by $3bn (4.4%), totaling $65.9bn in December 2022, compared to June 2022.
This decrease was driven by the decline in other investments by $3.9bn (14.6%) to register $22.9bn.
Meanwhile, other claims on nonresidents sustained a positive increase as follows: Reserve assets by $0.6bn (1.9%), to reach $32.1bn. Direct investment abroad increased by $173.9m (1.9%) to $9.2bn, and Portfolio investment abroad increased by $78.9m (4.8%) to $1.7bn.
Liabilities to non-residents increased by $10.8bn (3.6%) to $313.8bn in December 2022, compared to June 2022.
The Central Bank of Egypt – External Position (July/ Dec. 2022/2023). The increase was driven by the rise in other investments by $7.2bn (5.7%) to register $133.7bn, and foreign direct investment in Egypt by $5.7bn (4%) to reach about $148.9bn. However, portfolio investment in Egypt decreased by $2.1bn (6.3%) to $31.2bn.
Indicators
Egypt’s negative net IIP to GDP increased to 54% in December 2022, from 49% in June 2022. Assets to liabilities ratio decreased to 21% in December 2022, from 22.8% in June 2022.
© 2022 Daily News Egypt. Provided by SyndiGate Media Inc. (Syndigate.info).
