PHOTO
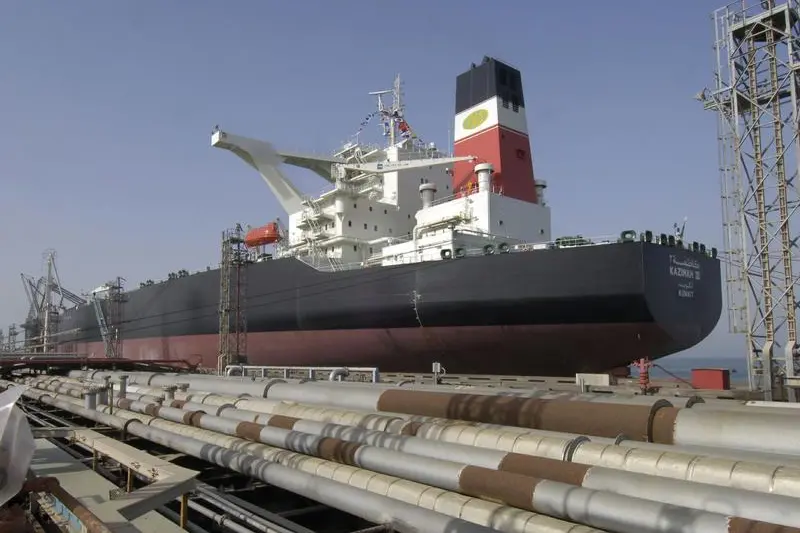
By the end of September 2017, the first half of the current fiscal year 2017/2018 ended and the average Kuwaiti oil price for September scored US$ 52.3 per barrel, up by US$ 3.8 per barrel, 7.8%, from Augusts average price of US$ 48.5 per barrel. It is also higher by US$ 7.3 per barrel, 16.2%, than the new budget hypothetical price of US$ 45 per barrel. The last fiscal year 2016/2017 which ended on March 31, 2017 scored an average price for Kuwaiti oil by US$ 44.7 per barrel. The average price of oil for September 2017 is 17% higher than the barrel average price for the past fiscal year but it is lower by US$ -18.7 per barrel than the parity price for the current budget at US$ 71 per barrel, according to the Ministry of Finance estimates after deducting the 10% for the Future Generations Fund, says Al-Shall Economic Report prepared by Al-Shall Consulting Co headed by Jassem Al-Saadoun.
According to the monthly follow up report of the States Financial Administration Accounts August 2017/2018 issued by Ministry of Finance, Kuwait has received about KD 5.304 billion in actual oil revenues until the end of August. Therefore, Kuwait would achieve oil revenues in the amount of KD 12.3 billion for the entire current fiscal year, which is higher by KD 0.6 billion than the estimated amount of oil revenues for the budget at KD 11.7 billion. Adding KD 1.6 billion in non-oil revenues, projected budget revenues would score KD 13.9 billion for the current fiscal year.
Comparing this figure with KD 19.9 billion for expenditures allocations, it is likely that the budget for 2017/2018 would face hypothetical deficit by KD 6 billion. If we assume saving by 6.3% in public expenditures, like last fiscal year, actual expenditures would drop to KD 18.6 billion, which is mere estimate, the public budget then would face a KD 4.5-5 billion deficit.
Trading Features at Boursa Kuwait September 2017
Kuwait Clearing Company issued its report titled Trading Volume According to Nationality and Category from 01/01/2017 to 30/09/2017 published on Boursa Kuwait official website. The report indicated that individuals are still the largest group, their share started to increase and they captured 49.44% of total value of sold shares (47.2% for the first nine months of 2016) and 49.39% of total value of purchased shares (42.1% for the first nine months of 2016). Individual investors sold shares worth KD 2.341 billion and purchased shares worth KD 2.339 billion with a net trading, selling, by KD 2.576 million.
The second largest contributor to market liquidity is the clients accounts (portfolios) which captured 22.8% of total value of sold shares (17.3% for the same period of 2016) and 21% of total value of purchased shares (15.4% for the same period of 2016). The sector sold shares worth KD 1.078 billion and purchased shares worth KD 994.349 million, thus making its net trading, more selling, by KD 83.403 million.
The third contributor, is the corporations and companies sector which captured 20.8% of total value of purchased shares (32.8% for the same period of 2016) and 20.6% of total value of sold shares (27% for the same period of 2016). The sector purchased shares worth KD 984.091 million and sold shares worth KD 977.522 million with a net trading, purchasing, by KD 6.569 million.
The last contributor to liquidity is the investment funds sector which captured 8.8% of total value of purchased shares (9.6% for the same period of 2016) and 7.2% of total value of sold shares (8.6% for the same period of 2016). This sector purchased shares worth KD 418.032 million and sold shares worth KD 338.622 million, with a net trading, more purchasing, by KD 79.410 million.
Boursa Kuwait continues to be a domestic Boursa with the Kuwaiti investors forming the biggest trading group and sold shares worth KD 4.203 billion capturing 88.8% of total value of sold shares (85.6% for the same period of 2016) and purchased shares worth KD 4.106 billion, capturing 86.7% of total value of purchased shares (86% for the same period of 2016). Thus, their net trading, the only one selling, scored KD 96.549 million, which is an indicator of a receding confidence of local traders.
Other investors share, out of total value of purchased shares, scored 9.1% (10.1% for the same period of 2016), and purchased shares worth KD 432.289 million, while their value of sold shares worth KD 364.931 million, 7.7% of total value of sold shares (11.2% for the same period of 2016). As a result, their net trading, more purchasing, scored KD 67.358 million.
Share of GCC investors, out of total value of purchased shares, formed 4.2% (3.8% for the same period of 2016), worth KD 196.534 million, while value of sold shares formed 3.5% (3.2% for the same period of 2016), worth KD 167.343 million, their net trading, purchasing, by about KD 29.191 million.
Relative distribution among nationalities changed from its previous one and became as follows: 87.7% for Kuwaitis, 8.4% for traders from other nationalities, and 3.8% for GCC traders vis--vis 85.8%, 10.7% and 3.5% for Kuwaitis, other nationalities and GCC traders respectively for the same period of 2016. This means that Boursa Kuwait remained a local one with the rise in the share of its investors from local traders. However, the turnout is still higher from investors mainly outside the GCC region than from the inside of the GCC region in which an overtrading of individuals is a dominant factor, who also increased their share with the increasing activity of the Boursa.
Number of active accounts between the end of December 2016 and the end of September 2017 rose by 16.8% (compared to a decrease by -37.8% between the end of December 2015 and the end of September 2016). Number of active accounts in the end of September 2017 scored 18,232 accounts, 4.8% of total accounts, versus 19,200 accounts in the end of August 2017, 5.1% of total accounts for the same month, with a decrease of -5% during September 2017.
Financial and Monetary Statistics June 2017
In its monthly statistical bulletin for the month of June 2017, published on its website, the Central Bank of Kuwait (CBK) stated that the balance of the total public debt instruments (bonds and tawarruq operations are included since April 2016) rose by KD 150 million to reach KD 3.967 billion in the end of June 2017, about 11.8%, of the nominal gross domestic product (GDP) for 2016 at about KD 33.5 billion. The average interest rate (return) on public debt instruments for one year was 2.000%, 2.250% for two years, 2.500% for three years, 3.000% for five years, 3.375% for seven years, 3.875% for ten years. Local banks capture 100% of the total public debt instruments.
The CBK bulletin stated that total credit facilities to residents offered by local banks in the end of June 2017 scored about KD 35.541 billion, about 56.8% of total local banks assets, a rise by about KD 653.5 million, above their value in the end of March 2017, a quarterly growth rate by about 1.9%. Total personal facilities scored about KD 14.754 billion, or 41.5% of total credit facilities (about KD 14.634 billion in the end of March 2017), a quarterly growth rate of about 0.8%.
Total value of installed loans there from scored about KD 10.480 billion, or 71% of the total value of personal facilities. An amount of KD 2.846 billion there from, about 19.3% of the total, went for the purchase of securities. Consumer loans amounted to about KD 1.109 billion. Credit facilities to the real estate sector amounted to about KD 8.012 billion, or 22.5% of the total, (about KD 7.812 billion in the end of March 2017), about two-thirds of the credit facilities go to personal and real estate facilities. KD 3.401 billion, 9.6%, went to trade sector (KD 3.250 billion in the end of March 2017). KD 2.070 billion, 5.8%, went to the contracting sector (KD 2.112 billion in the end of March 2017). KD 1.923 billion, 5.4%, went to the industry sector (KD 1.790 billion in the end of March 2017). KD 1.317 billion, 3.7%, went to the non-bank financial institutions (KD 1.354 billion in the end of March 2017).
The bulletin also indicated that total deposits at local banks scored about KD 41.592 billion, representing about 66.5% of total local banks liabilities, a drop by about KD 352.5 million below their value in the end of March 2017, a quarterly decline rate by about -0.8%. About KD 34.599 billion, 83.2%, belong to clients of the private sector in the comprehensive definition including major institutions like the Public Institution for Social Securities does not include the government. About KD 32.139 billion thereof in Kuwaiti dinars, 92.9%, went to private sector clients and the equivalent of KD 2.460 billion were in foreign currency to private sector clients, too.
As for the average interest rates on customers time deposits, both in the Kuwaiti dinar and the US dollar, vis-a-vis the end of March 2017, the bulletin stated that it continued its rise on both of the KD & US$ deposits. The difference in the average interest rates on customers deposits for a term is still in favor of the Kuwaiti dinar in the end of the two periods. It scored about 0.710 point for 1-month deposits, about 0.718 point for 3-month deposits, about 0.729 point for 6-month deposits, and about 0.679 point for 12-month deposits. The difference in the end of March 2017 was about 0.572 point for 1-month deposits, about 0.648 point for 3-month deposits, about 0.672 point for 6-month deposits, and about 0.571 point for 12-month deposits. The monthly average exchange rate for the Kuwaiti dinar against the US dollar in June 2017 was about 303.370 Kuwaiti fils for each one US dollar, a slight increase by 0.6% compared with the monthly average for March 2017 when it scored about 305.152 fils per one US dollar.
Gross Domestic Product (GDP) 2016
The Central Statistical Bureau (CSB) published on its website, preliminary estimates of the Gross Domestic Product (GDP), at current prices for 2016, scored about KD 33506.6 million, which is equalviant to about US$ 110.9 billion. The (CSB) amended 2015 figures upwards to about KD 34473.3 million instead of KD 34314.6 million, with amendment percentage of about +0.5%, making the nominal growth rate in 2015, compared to 2014 at -25.5%, instead of about -25.9%. Therefore, the nominal growth rate in 2016, compared to 2015, decreased by -2.8%. The GDP per capita, decreased from about KD 11311 in 2014 to about KD 8132 in 2015, and to about KD 7536 in 2016, which is equivalent to about US$ 24.9 thousand, a decrease by -7.3%.
Volume of final consumption expenditure amounted to about KD 23857.7 million, rose by 5.3% compared to 2015, and represents about 71.2% of the GDP versus 46.7% and 65.7% in 2014 and 2015 respectively. Net savings decreased from about KD 7752.5 million in 2015 to about KD 5387.8 million in 2016, a noticeable drop by -30.5%. The net capital formation rate scored about 18% of GDP.
Extraction of Crude Petroleum and natural gas, as a component in the GDP, scored about KD 12715.8 million, as a result of a decrease in oil prices in the international oil market and its production, versus KD 14775 million in 2015, a drop by -13.9% compared to 2015. Its contribution to GDP, including relevant services, scored about 38.3%, down from about 43.2%, in 2015. The contribution of the oil sector to the economy will go up by 7.3% if we add the contribution of refined oil products.
The share of non-oil sectors scored KD 25348.9 million up from about KD 24838.9 million in 2015, a rise by 2.1%. The contribution of these sectors to GDP was at 75.7%, up from about 72.1% in 2015. The largest non-oil sectors contributing to GDP is the community, social and personal services sector mostly public sector with about KD 8906 million, or 26.6% of the GDP. But the financial services sector, including financial institutions banks and investment companies insurance, real estate and business services most of which are private sector have contributed KD 7119.2 million, or 21.2% of the GDP, and then the transport, storage and communications sector, which contributed to about KD 2570.4 million, or 7.7% of the GDP.
The Weekly Performance of Boursa Kuwait
The performance of Boursa Kuwait for last week was more active compared to the previous one, where all indexes showed an increase, the traded value index, the traded volume index, number of transactions index, and general index, AlShall Index (value weighted) closed at 437.5 points at the closing of last Thursday, showing an increase of about 12.3 points or about 2.9% compared with its level last week, it increased by 74.5 points or about 20.5% compared with the end of 2016.
The following tables summarize last weeks performance of Boursa Kuwait
Description Week 40 Week 39 Diff
05/10/2017 28/09/2017 %
Working days 5 5
AlShall index (34 Companies) 437.5 425.2 2.9%
Boursa Kuwait index (price) 6,662.1 6,679.7 -0.3%
Value Trade (KD) 158,058,559 108,974,254
Daily average (KD) 31,611,712 21,794,851 45.0%
Volume Trade (Shares) 829,598,551 529,109,825
Daily average (Shares) 165,919,710 105,821,965 56.8%
Transactions 25,602 19,135
Daily average (Transactions) 5,120 3,827 33.8%
Most Active Companies & Sectors
Description Value Traded % of Total
Companies KD Market
Mobile Telecom Co K.S.C (Zain) 40,052,130 25.3%
Kuwait Finance House 18,827,337 11.9%
Gulf Bank Of Kuwait 15,959,516 10.1%
National Bank Of Kuwait 13,441,780 8.5%
National Industries Group (Holding) 8,130,681 5.1%
Total 96,411,444 61.0%
Description Value Traded % of Total
Sectors KD Market
Banks Sector 63,857,040 40.4%
Telecommunications Sector 40,490,775 25.6%
Financial Services Sector 31,205,834 19.7%
Industrials Sector 10,801,737 6.8%
Real Estate Sector 9,016,949 5.7%
Al Shall Index Week 40 Week 39
05/10/2017 28/09/2017
Increased Value (# of Companies) 18 8
Decreased Value (# of Companies) 5 20
Unchanged Value (# of Companies) 11 6
Total Companies 34 34
2017 Arab Times Kuwait English Daily. All Rights Reserved. Provided by SyndiGate Media Inc. (Syndigate.info).
