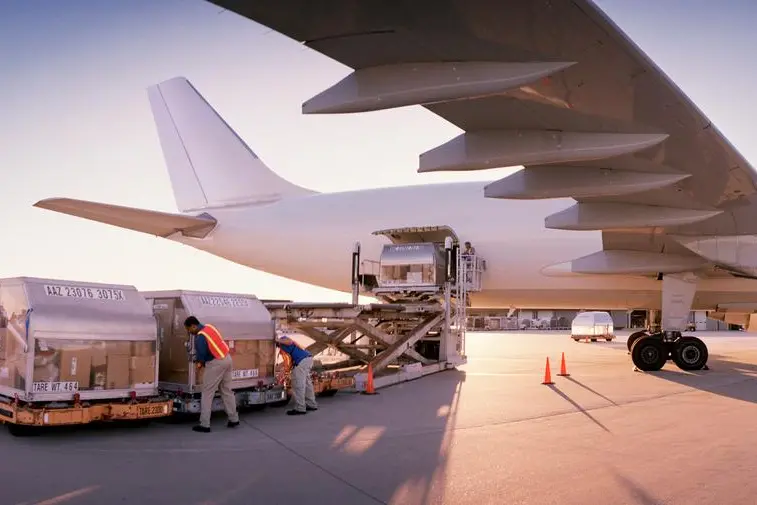
PHOTO
Middle East & South Asia (MESA) and Asia Pacific led in terms of the YoY air cargo percentage tonnage increases in July, with +21% and +17%, respectively, according to the latest figures and analysis from WorldACD market data.
This was followed by Africa (+14%), Europe (+11%), Central & South America (CSA, +8%) and North America (+6%), taking worldwide growth to +13%.
Strong air cargo demand continued in July from all of the main global origin regions, including double-digit year-on-year (YoY) percentage increases in tonnages from four of the six main regions.
Cross-border e-commerce
Although there’s been much talk this year about the growth of cross-border e-commerce driving air cargo, especially from China and Hong Kong, analysis by WorldACD highlights that there has also been significant growth from most major regions and among various of the special cargo categories this year, alongside the strong growth of general cargo traffic that has been boosted by buoyant e-commerce volumes.
That’s broadly consistent with the pattern for the year to date (YtD), with tonnages for the first seven months up globally by +12% compared with January to July 2023, and from MESA and Asia Pacific up by +20% and +19%, respectively. Most of the regions also recorded tonnage growth compared with the previous month (MoM), with only North America recording a small drop in tonnages (-1%) and CSA flat.
Asia Pacific dominates tonnage growth
Further analysis of the flown chargeable weight growth this year, including on a subregional basis, reveals that China, Southeast Asia and Northeast Asia together accounted for more than half (56%) of the YoY worldwide tonnage growth in the first seven months of 2024.
Based on the more than 2 million monthly transactions covered by WorldACD’s data, 18 of the world’s 23 subregions recorded growth in that period, led by Central Asia (+55%), the Gulf Area (+33%), Balkan & Southeast Europe (+24%), North Africa (+23%), China (+22%), Southeast Asia (+20%) and South Asia (+20%). The only three subregions recording significant declines in tonnage in that period were Mexico (-10%), the Caribbean (-8%), and Levant & Caucasus (-5%).
Hong Kong once again topped the list of individual airport growth markets in terms of absolute weight increases, with a year on year increase of around 21 million kg in July, followed by Bangkok, Shenzhen, Shanghai and Guangzhou – although Shenzhen and Bangkok were higher in percentage terms (+37% and +34%, respectively). Dubai recorded the highest inbound increase at +12 million kg in July (+24%), followed by Frankfurt ( +23%) Los Angeles (+13%) Amsterdam ( +11%) and New York (+7 million kg, +12%). The biggest inbound decrease was once again recorded in Tel Aviv (-3 million kg, -22%), followed Greenville, Leipzig, Houston, and Luxembourg.
Four out of five of the individual markets recording the biggest decreases in outbound tonnages were in China – Wenzhou, Ningbo, Xiamen, and Qingdao – with Indore in India taking the fifth spot, although in absolute weight terms the numbers were not huge, ranging from a drop of -492 tonnes in Wenzhou to -114 tonnes in Indore.
Not only China growing
Although China and Hong Kong feature prominently among this year’s top air cargo growth markets, with China and Hong Kong together recording a +22% tonnage increase in the YtD to July, the rest of the world has also achieved strong combined growth of +10% this year, analysis reveals.
Balance of general cargo vs special cargo growth
As noted in a previous Trends report, the growth of ‘general cargo’ air freight tonnages has been outpacing that of ‘special cargo’ products this year, with general cargo growing by an average of +13%, YoY, in the YtD January-July period, compared with +10% for special cargo products. This change from the longer-term trend is mainly due to the exceptionally strong growth since last autumn in cross-border e-commerce traffic – which often flies as general cargo rather than within a special cargo handling category.
But it’s also worth highlighting that at +10%, the growth of special cargo products this year is also strong by historical standards. Among the special cargo product categories there has been extremely strong (+24%) YoY growth in worldwide shipments of vulnerable/high-tech cargo and in meat shipments.
Fruit & vegetables traffic grew by +8%, flowers by +6%, valuables and dangerous goods shipments each grew by +3%, and pharma/temp (temperature-controlled – predominantly pharma – shipments) saw a small increase (+1%). Meanwhile, fish & seafood also saw a small increase (+1%), while live animal shipments dropped by -6%, and human remains by -9%, YoY.
Globally, the proportion of special cargo products within the total market averaged 35% in the YtD to July. But analysis according to the origin region of the cargo reveals some significant differences in both their ratios and their respective rates of growth. For example, general cargo makes up around 70% of the key Asia Pacific origin market, although the growth of special cargo from Asia Pacific (+23%) is higher this year than for general cargo (+17%), analysis by WorldACD reveals.
In contrast, for the MESA origin market – which has been particularly impacted by disruptions to container shipping this year – general cargo growth (+29%) far outpaced the YoY growth of special cargo (+6%) in the YtD to July.
Capacity continues to rebound
Despite the usual seasonal fluctuations, the total amount of air cargo capacity available in the global market has continued to rebound, with capacity in July around +9% higher than in July 2023. That in part reflects a particularly large increase in July 2024, including a +7% increase compared with June, although YtD capacity for the seven months to July was also up by +7%, YoY.
The biggest capacity increase has been from Asia-Pacific, to meet strong demand for uplift for exports from the region, with a capacity increase of +14% for the year to date, and +13% for July 2024, YoY – and also a +7% increase compared with the previous month, June 2024.
On the pricing side, average worldwide rates in July were up +10%, year and year, boosted by big rises in prices from MESA (+51%) and Asia Pacific (20%) – based on a full-market average of spot rates and contract rates. But if we look at spot rates specifically, the increases this year are even higher, averaging more than +100% from MESA origins to Europe and more than +50% from Asia Pacific origins.
Meanwhile, increases in capacity on key head-haul legs from Asia Pacific and MESA, to accommodate the increases in demand, have caused prices on some of the respective back-haul lanes to drop significantly – for example, from Europe to Asia. This has contributed to marked falls in rates from Europe and from North America origins, where average prices for the seven months to July were down by -25% and -17%, respectively. But by July, those rates appeared to have broadly stabilised, rising from Europe origins by +1% in July compared with the previous month, and with rates ex-North America down by just -1%, MoM.
Copyright 2024 Al Hilal Publishing and Marketing Group Provided by SyndiGate Media Inc. (Syndigate.info).